 Sometimes it happens, and it happened this time. Monday, Dec. 31st 2018. Since mid 2016, PIMI Editorial decided to publish its weekly newsletters (Symbolized by “NewsLetter”) each Monday night Greenwich time due to last checkout in PIMI UK Office.
This time (week) at the same weekly agenda, half of the world had shaken glasses and passed new year’s kisses and half of the word were waiting to do later. Another simultaneous action was our monthly statistics for declaration of “Top 10 Countries/Visitors” which we will do it, when the 1st of each month has finished at most east American point (Kirtimati). So, this was another conflict for publication of PIMI NewsLetter No. 117, which could have been the last one for 2018 or the first one in 2019. Many discussions came to this end; Publication of the last PIMI Newsletter for 2018, on Jan. 2nd 2019, when everything seems to be a fare play.
Now, you got it on Wed. Jan. 2nd and have a little more time to compare in between what we were standing on Jan. 1st 2018, and how we are doing in the starting date of 2019.
On Jan. 2nd 2017 the issue no. 67 of PIMI newsletter published on time (Monday night) with a face that still needed to be approved, now we are publishing issue no. 117 that means 51 issues (even one more than we had promised; 50/year).
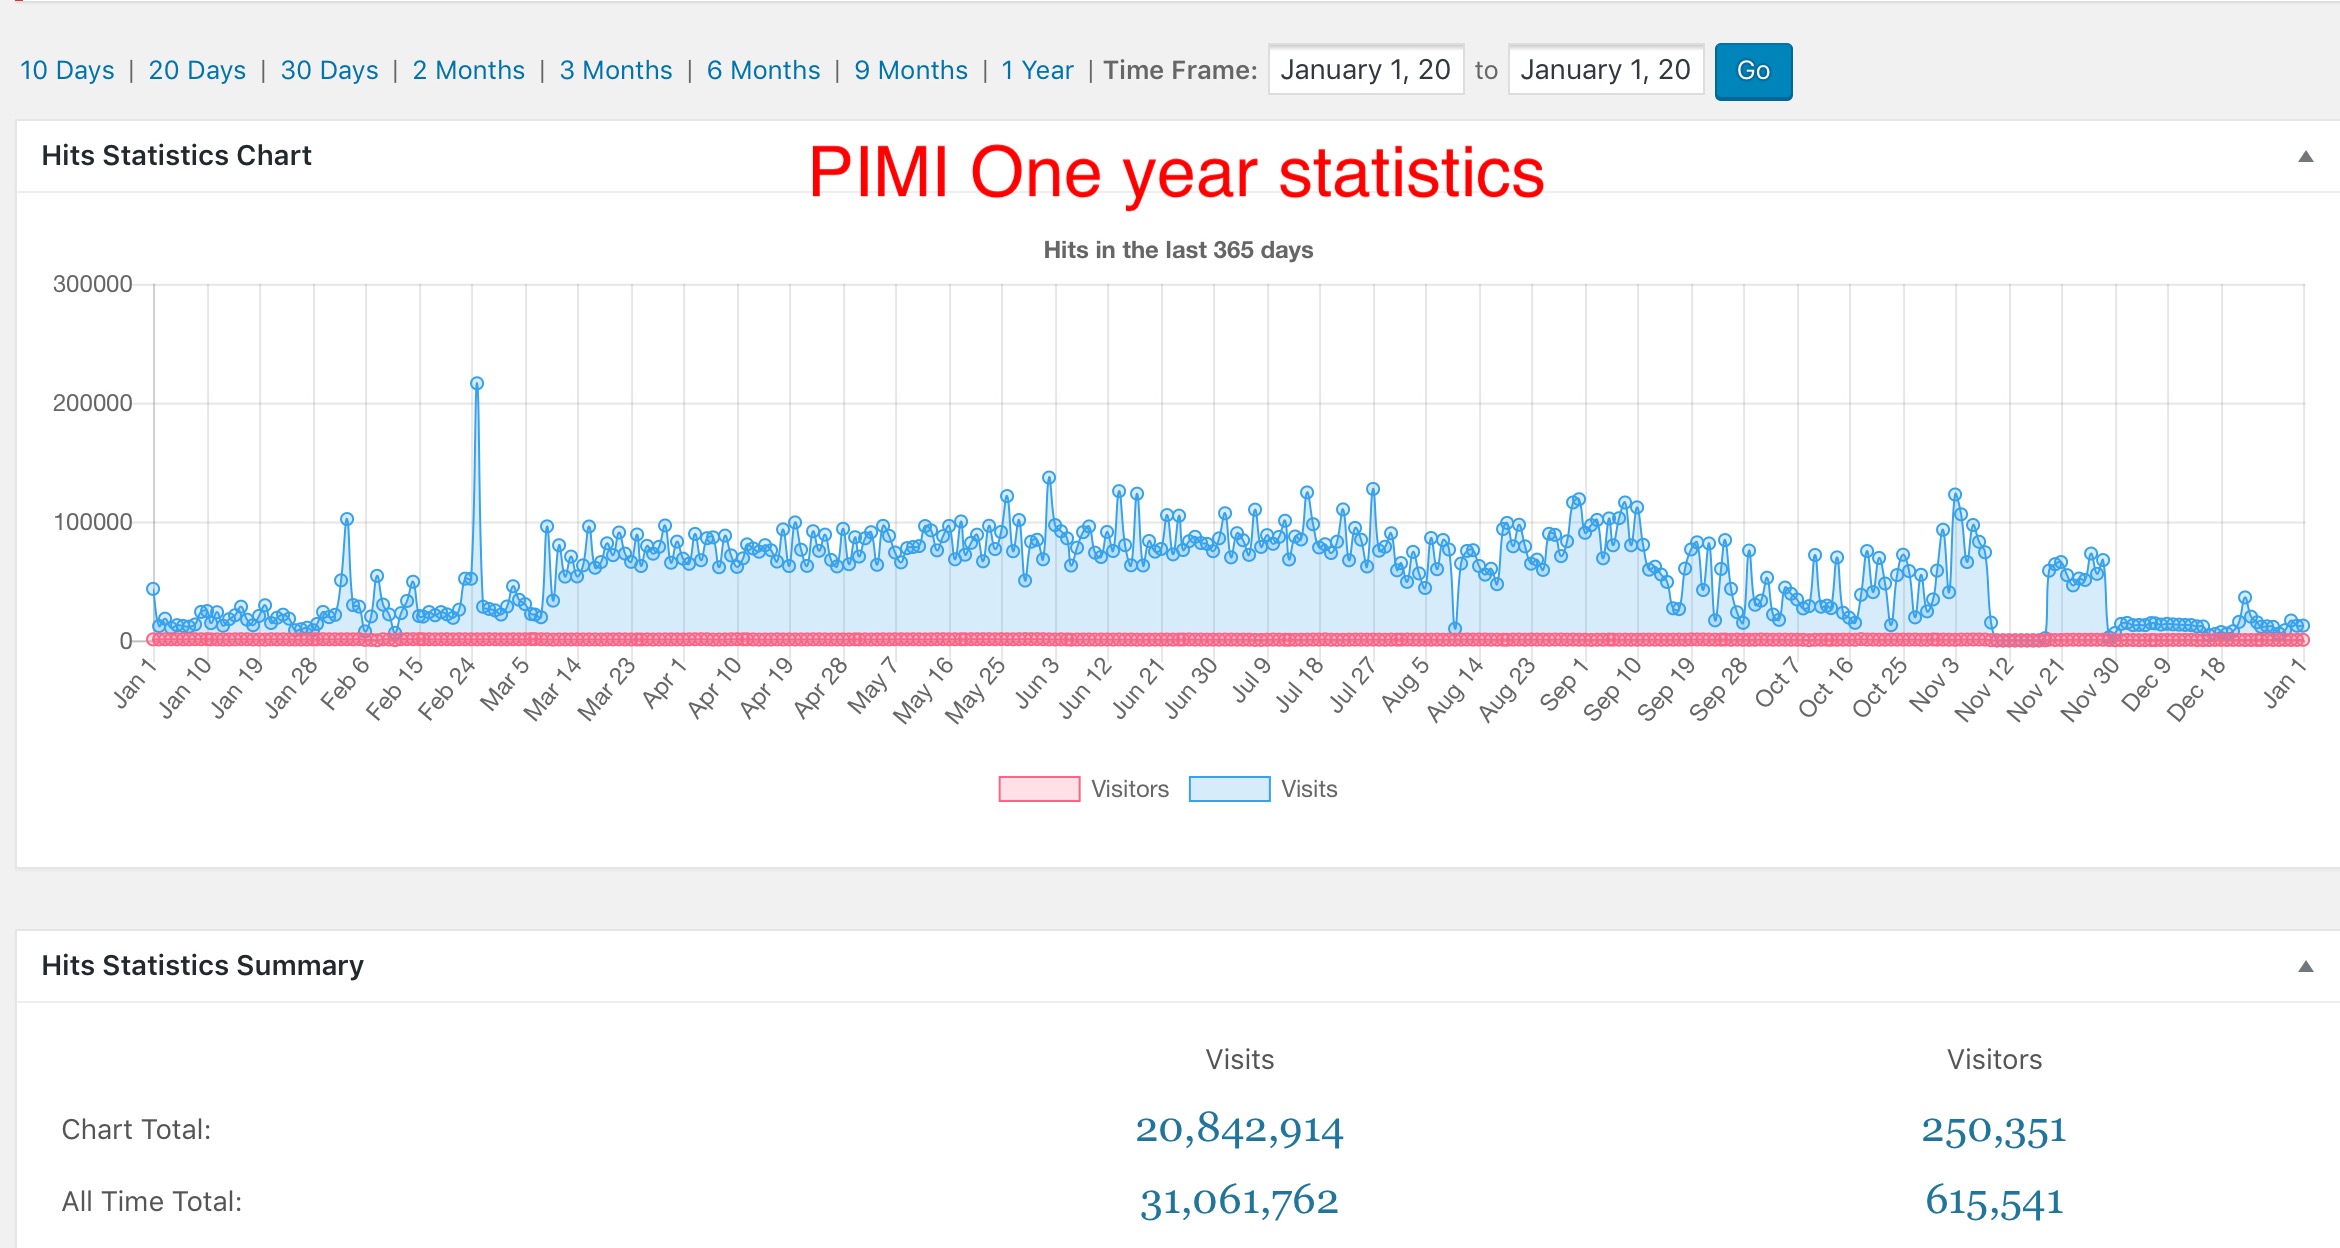
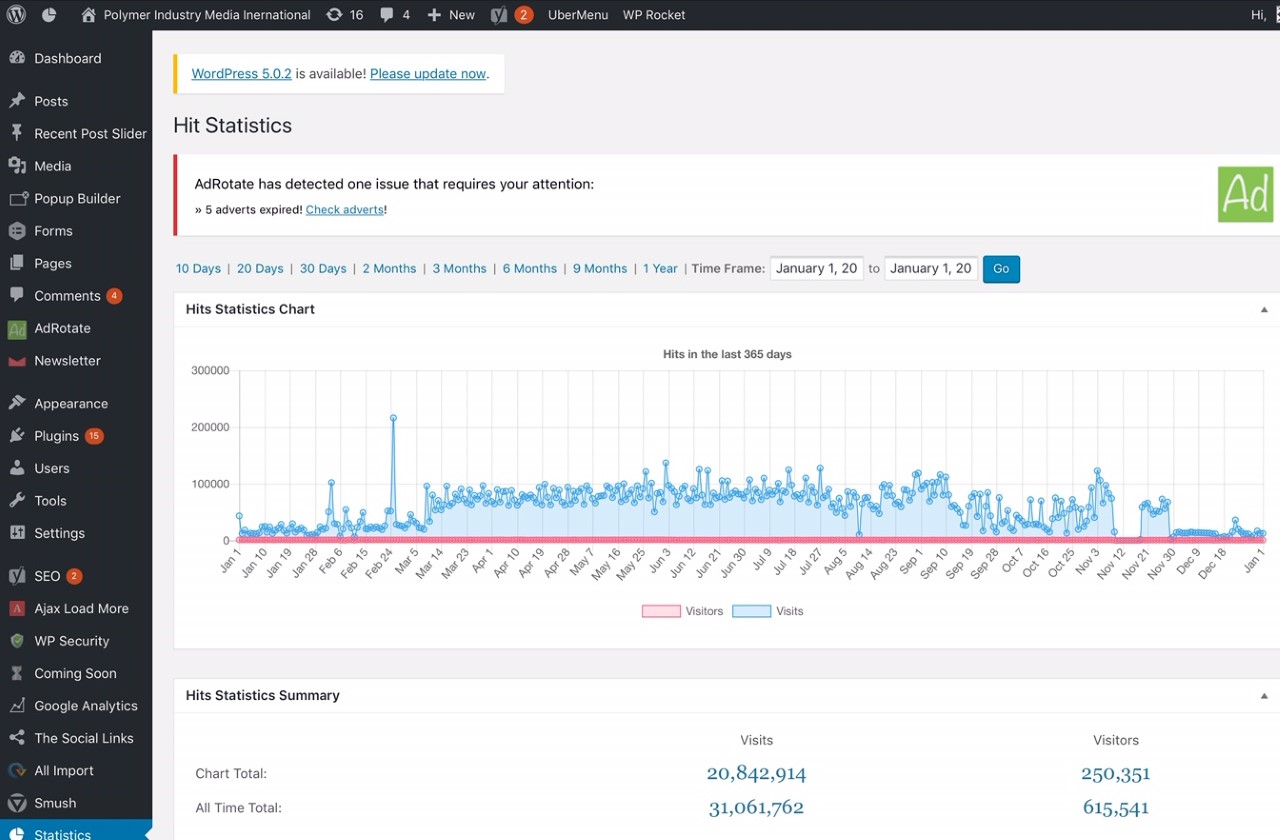
At the end of 2017, PIMI pages and other parts had been clicked by 250,351 visitors with a total number of 20,842,914 times, i.e., an average of 83.25 times per unique IP/Viewer. However, such proudly figures will turn to other amazing figures;
1- In 2018 the total number of PIMI logged-in viewers (means robots-excluded exact figures) increased to 615,541 meaning an increase of 365,190 more viewers with a total click number of 31,061,762 giving the average of 50.46 times per unique IP/Viewer;
2- Deducting up to the end of 2017 viewers and click numbers from what has been added in 2018, we will have the net figures of 10,218,848 clicks by 365,190 giving an average of 27.98 unique IP/Viewer which in our opinion, is more wise and more hopeful as it shows an increase of more specialty viewers than casual ones of the last 3 years;
3- In 2018, a total number of 7 cyber attacks were discovered at our website, and following the pathways gave us the following records for the hackers numbers/country/%: Russia/53%; China/22%; USA/13%; Ukraine/9%; Others/3%. (To compare you may have a look atthe following chart which shows the number of clicks and new visitors from Jan. 1st 2018-Jan. 1st 2019)
4- The most attacking efforts (82%) aimed to add the URL’s belonging to the websites that sell illegal addiction drugs, and so on, 6% for stealing data banks, 11% to bringing down the PIMI Channel (unfortunately most of it from Iran, then, 1 from Turkey and 1 from Saudi Arabia). Thanks to a 7/24/365 days of alerting colleagues which have made all of these attacks intact.
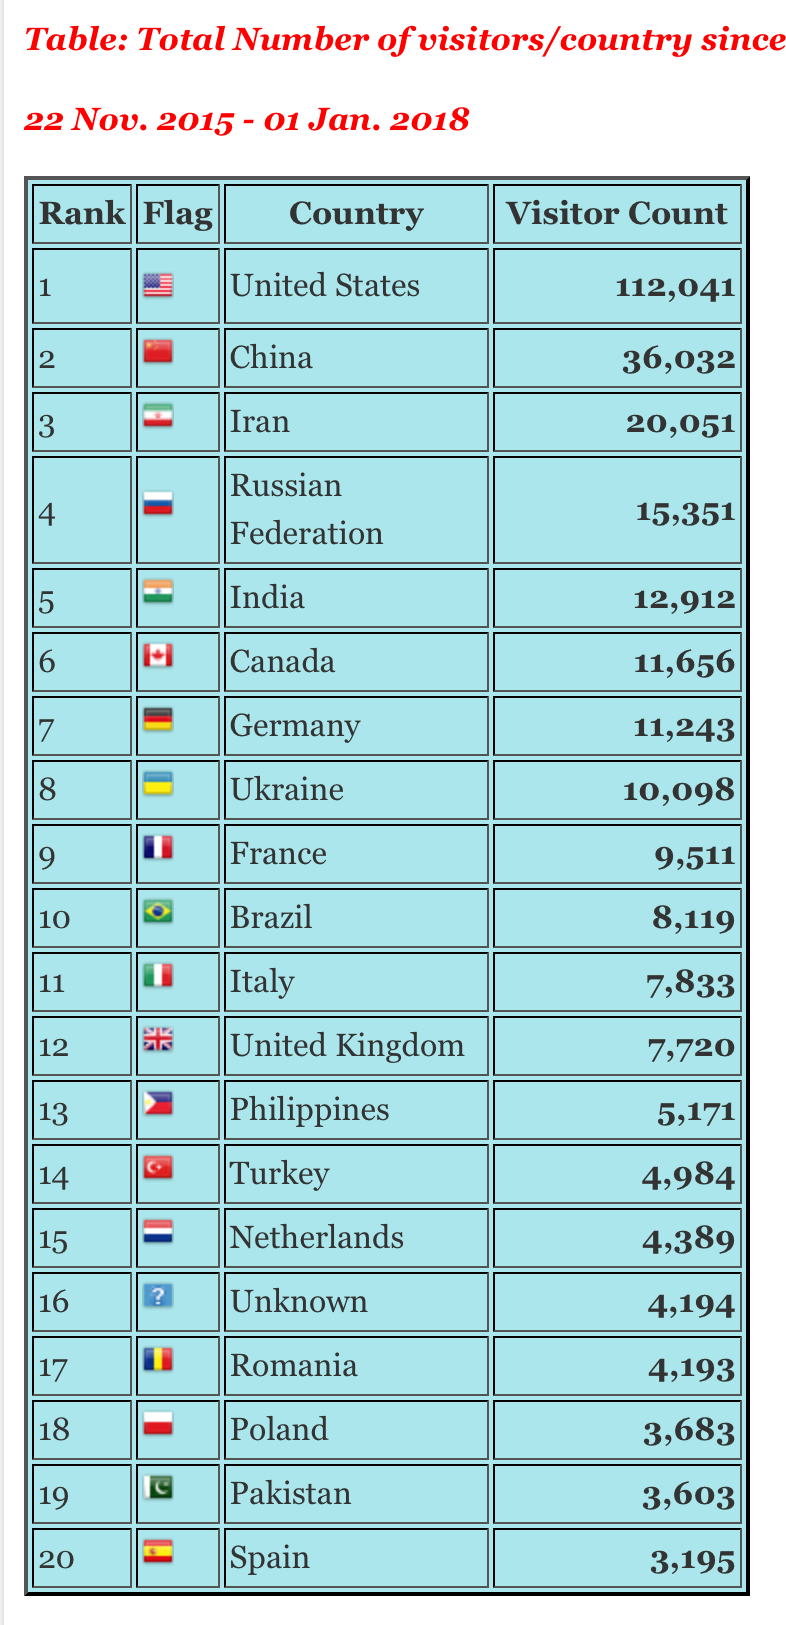
5- On Jan. 1st 2018, the American visitors of the PIMI Channel had recorded 112,041 unique IP/Viewer and remained at the to for the 2.5 year of launching the PIMI officially (Nov. 22nd, 2015). Since that time, specially during 2018 by more pressure from the President Trump’s administration over Iran, a of changes were observed in the number and the ranking of countries which each month we announce as the first 10 Visitors/Country at our home page.
Table: Total Number of visitors/country since
22 Nov. 2015 – 01 Jan. 2018
| Rank | Flag | Country | Visitor Count |
| 1 |  |
United States | 112,041 |
| 2 |  |
China | 36,032 |
| 3 |  |
Iran | 20,051 |
| 4 |  |
Russian Federation | 15,351 |
| 5 |  |
India | 12,912 |
| 6 |  |
Canada | 11,656 |
| 7 |  |
Germany | 11,243 |
| 8 |  |
Ukraine | 10,098 |
| 9 |  |
France | 9,511 |
| 10 |  |
Brazil | 8,119 |
| 11 |  |
Italy | 7,833 |
| 12 |  |
United Kingdom | 7,720 |
| 13 |  |
Philippines | 5,171 |
| 14 |  |
Turkey | 4,984 |
| 15 |  |
Netherlands | 4,389 |
| 16 |  |
Unknown | 4,194 |
| 17 |  |
Romania | 4,193 |
| 18 |  |
Poland | 3,683 |
| 19 |  |
Pakistan | 3,603 |
| 20 |  |
Spain | 3,195 |
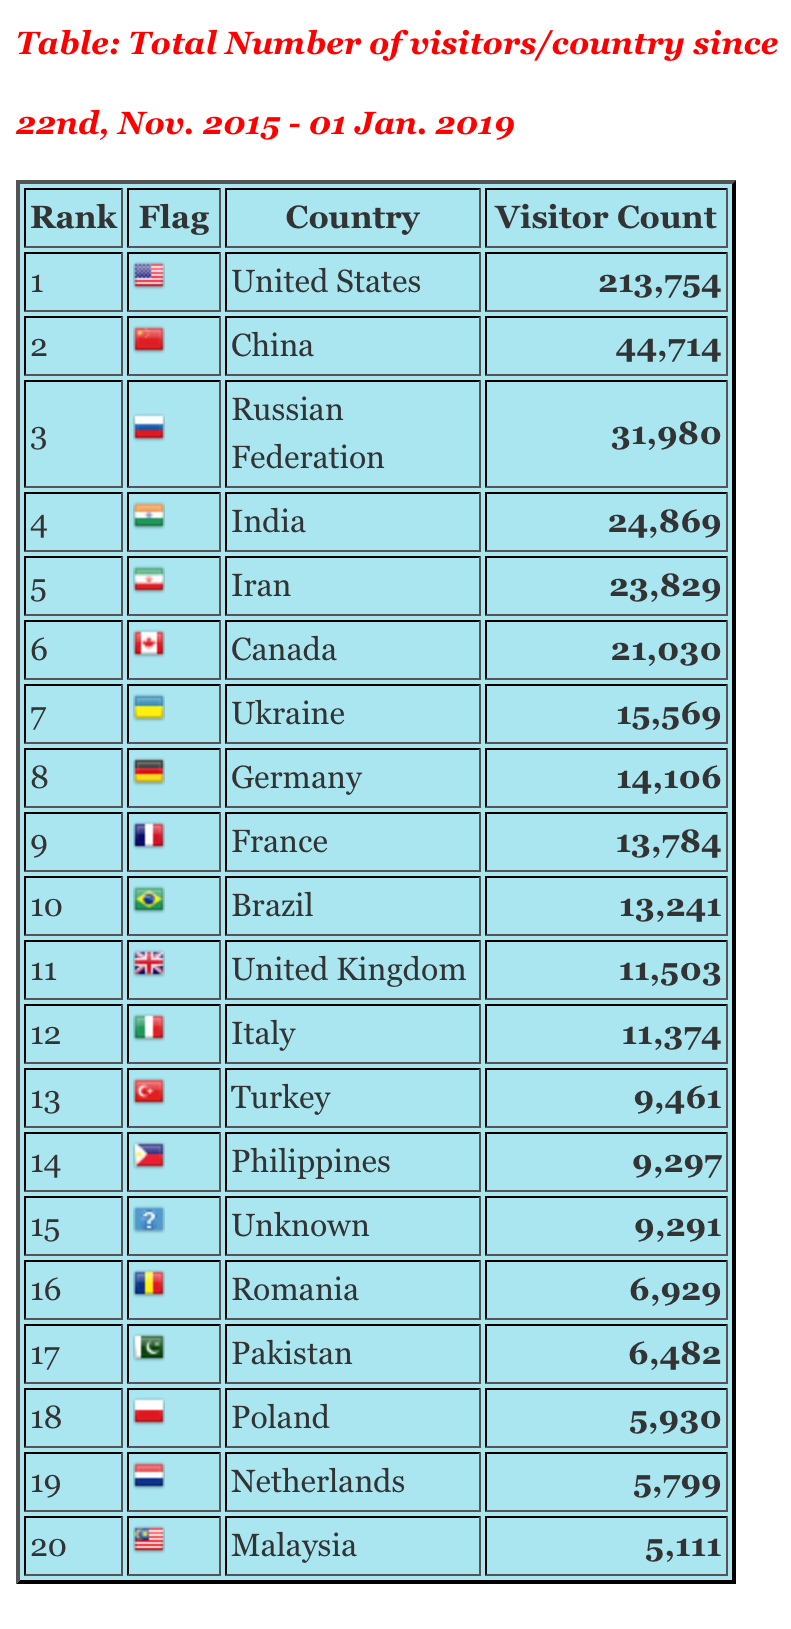
Table: Total Number of visitors/country since
01 Jan. 2018 – 01 Jan. 2019
| Rank | Flag | Country | Visitor Count |
| 1 | |
United States | 213,754 |
| 2 | |
China | 44,714 |
| 3 | |
Russian Federation | 31,980 |
| 4 | |
India | 24,869 |
| 5 | |
Iran | 23,829 |
| 6 | |
Canada | 21,030 |
| 7 | |
Ukraine | 15,569 |
| 8 | |
Germany | 14,106 |
| 9 | |
France | 13,784 |
| 10 | |
Brazil | 13,241 |
| 11 | |
United Kingdom | 11,503 |
| 12 | |
Italy | 11,374 |
| 13 | |
Turkey | 9,461 |
| 14 | |
Philippines | 9,297 |
| 15 | |
Unknown | 9,291 |
| 16 | |
Romania | 6,929 |
| 17 | |
Pakistan | 6,482 |
| 18 | |
Poland | 5,930 |
| 19 | |
Netherlands | 5,799 |
| 20 |  |
Malaysia | 5,111 |
In order to have a better possibility to compare changes between the two periods (Nov. 22nd, 2015- Jan. 1st, 2018) and (Nov. 22nd 2015- Jan. 1st, 20190 we also publish the images of the above tables besides each other hereinafter:
Out of all of these statistics we may speak a lot about our successes, but we prefer you do it, specially when you are going to decide backup this only media of its kind that is launched from Iran by a private investor and fully independent of the country’s international policies which we are against most of it, as far as our dilemma dictates.
**************
Now it is the time to resume our daily activities after another time of wishing all the bests and the global peace for every single humankind on earth.
Ahmad Ali Saatnia
***************