 Although Japan, Germany and Taiwan are the first three in ranking of exporting plastics processing machinery to China, however Chinese statistics show that USA, Vietnam and India are the first three export destinations for the Chinese made machinery and Iran is located at the 10th row of the importers from China with a total value of 61.37 millions of US$. This composes only 3.08% of the total value of machinery exported to other countries. USA stands at the first destination of the Chinese exports with a value of 10.69%.
According to the report of China Plastics Machinery Industry Association (CPMIA), From January to November, China imported 19,717 units of plastics processing machinery, a drop of 27% YoY. However, import values increased by 31% to US$1.605 billion. The per unit import price was US$80,000 (US$50,000 in previous year).
Machines from other Asian countries constituted the major portion of China’s imports, in which 15,624 units were shipped to China at US$936 million. They represent 79.28% and 58.09% of the total import volumes and values respectively.
In particular, imports from Japan grew by 49.96% and 43.20% in volumes and values compared with the same period of previous year.
Imports from Europe amounted to 2,368 units at US$592 million, representing 12.02% of the total volume and 36.73% of the total values. Germany’s import volumes dropped 36.36%, but values were increased by 16.36%, while import volumes from Italy grew 47.15%, but values dropped 0.65%.
There are 402 enterprises above designated size in the Chinese plastics machinery industry. In November, both income from major operations and profit increased more than 12% YoY.
2017 Top 10 import destinations of Chinese plastics machinery:
| Ranking | Country | Import volumes | Import values (US$ mil) | % of total volume | % of total value |
| 1 | Japan | 5,013 | 673.63 | 25.42% | 41.96% |
| 2 | Germany | 1,353 | 402.79 | 6.86% | 25.09% |
| 3 | Taiwan | 1,712 | 144.10 | 8.68% | 8.98% |
| 4 | South Korea | 711 | 74.73 | 3.61% | 4.65% |
| 5 | Italy | 284 | 71.23 | 1.44% | 4.44% |
| 6 | The US | 1,632 | 61.92 | 8.28% | 3.86% |
| 7 | Austria | 155 | 39.81 | 0.79% | 2.48% |
| 8 | Switzerland | 47 | 28.17 | 0.24% | 1.75% |
| 9 | Canada | 62 | 20.96 | 0.31% | 1.31% |
| 10 | France | 87 | 17.14 | 0.44% | 1.07% |
| Total: | 11,056 | 1534.47 | 56.07% | 95.58% | |
Top 10 import destinations of China’s plastics machinery (Jan – Nov, 2017)
2017 Top 10 Chinese plastics machinery export destinations:
| Ranking | Country | Import volumes | Import values (US$ mil) | % of total volume | % of total value |
| 1 | The US | 259,455 | 212.90 | 35.20% | 10.69% |
| 2 | Vietnam | 17,687 | 185.40 | 2.40% | 9.31% |
| 3 | India | 3,986 | 102.41 | 0.54% | 5.14% |
| 4 | Mexico | 4,395 | 94.01 | 0.60% | 4.72% |
| 5 | Turkey | 2,584 | 84.97 | 0.35% | 4.27% |
| 6 | Thailand | 5,485 | 81.67 | 0.74% | 4.10% |
| 7 | Indonesia | 2,841 | 79.60 | 0.39% | 4.00% |
| 8 | Bangladesh | 1,669 | 65.09 | 0.23% | 3.27% |
| 9 | Malaysia | 5,567 | 63.86 | 0.76% | 3.21% |
| 10 | Iran | 4,190 | 61.37 | 0.57% | 3.08% |
| Total: | 307,859 | 103.128 | 41.77% | 51.80% | |
Top 10 China plastics machinery export destinations (Jan – Nov, 2017)
Higher export volumes and value
Based on the same source, a total of 737,021 units of plastics machinery were exported with value of US$1.991 billion in the first eleven months of 2017, according to the report of China Plastics Machinery Industry Association (CPMIA).
This represents an increase of 33% and 11% YoY (Year over Year) on export volumes and export value respectively. Meanwhile, the per unit export price was US$3,000.
Injection molding machines, extruders, blow molding machines, bridge-die-forming machines and calendar forming machines were the major types of machines being exported. In total, 87,813 units were exported at US$1.717 billion from January to November, representing 11.91% of the total export volume and 86.23% of the export values.
As a result, China recorded a favorable balance of US$386 million in plastics machinery trading.
Of the 10 major export destinations of Chinese plastics machinery, the US, India, Mexico, Bangladesh and Malaysia experienced a faster growth. In particular, 259,455 units were exported to the US through January to November, up 79.21% when compared to previous year’s same period. The Chinese 3D printers comprised 83.93% of the total export volumes, continuing to take the US market by storm.
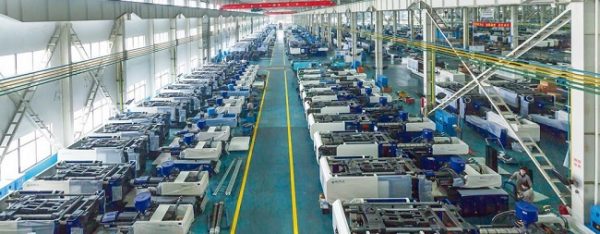
Image from “China Haitian”


