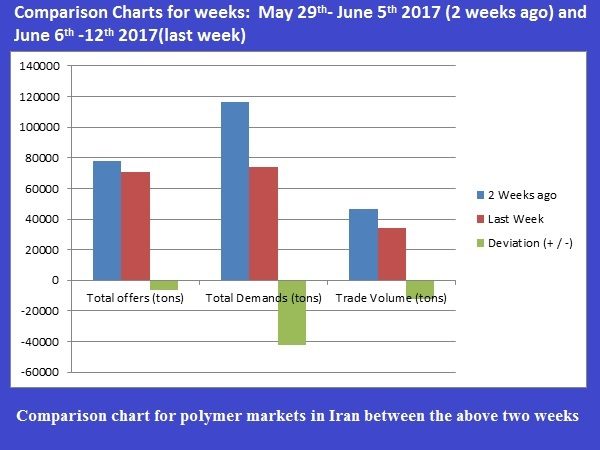
 Iranian Polymer Market Experienced Decreasing in Supply and Demands: Last week, at the 3rd week of the 3rd Iranian month (Khordad) and the 2nd week of June (6-12 June) not only the Iranian plastics convertors but also the IME trade hall had a very cool period and faced with decreases in all 3 indices; Supply, Demands and Trade Volumes.
The 2nd week of the June, in addition to the special atmosphere of Ramadan which automatically slows down the businesses, there were also two consecutive holidays on Sunday and Monday that resulted almost one week of self-decided holidays by most people. Due to this, instead of two days of material bids there was only a day (Tuesday)، and the final result was a great decrease in offers (petrochemicals’ supplies), demands and the trade volumes. First let’s have a look at the tables and charts.
Table 1: Comparison Charts for weeks: May 29th– June 5th 2017 (2 weeks ago) and June 6th -12th 2017(last week)
| Comparison table for polymer markets in Iran between two above weeks | |||
| PIMI.IR Portal | 2 Weeks ago | Last Week | Deviation (+ / -) |
| Total offers (tons) | 77578 | 71003 | -6575 |
| Total Demands (tons) | 116140 | 74198 | -41942 |
| Trade Volume (tons) | 46594 | 34184 | -12410 |
US$ for calculation of the base price for deals at IME: For 2 weeks ago, 1US$= 37.284 Rials and for Last week, 1 US$= 37.265 Rials at the same time and the same day the US$ price in free market on June 06th Was 37.300 Rials.
Table 2: Materials offered and sold Between June 6th -12th 2017(last week)
| Grade | Offers
(Two week ago-tons) |
Average
Base Price (Last Week) |
Highest
Sold Price (Rials) |
Offers
(Last Week) (tons) |
Demands
(Last Week-tons) |
Trade
Volume (Tons) |
Offers
Deviations Volumes +/- |
|
| HDPE | ||||||||
| Blowing | 6.986 | 38.284 | 38.284 | 6.480 | 826 | 826 | – 506 | |
| Extrusion | 8.400 | 42.089 | 42.089 | 7.640 | 8.276 | 6.810 | – 760 | |
| Injection | 1.492 | 37.262 | 37.970 | 986 | 44 | 44 | – 506 | |
| Film | 4.352 | 38.944 | 38.944 | 4.572 | 378 | 378 | + 220 | |
| Rotational | 1.206 | 38.938 | 38.938 | 1.406 | 390 | 390 | + 200 | |
| LDPE | ||||||||
| Film | 10.572 | 41.803 | 45.983 | 5.470 | 10.556 | 2.896 | – 5.102 | |
| Injection | ||||||||
| LLDPE | ||||||||
| Film | 1.986 | 39.488 | 40.709 | 4.092 | 1.844 | 1.824 | + 2.106 | |
| PC | ||||||||
| PET | ||||||||
| Bottle | 6.028 | 34.160 | 38.119 | 8.052 | 13.530 | 7.018 | + 2.024 | |
| Fibre | 5.016 | 31.942 | 32.930 | 6.028 | 1.067 | 1.067 | + 1.012 | |
| PP | ||||||||
| Injection | 4.715 | 43.271 | 47.598 | 4.369 | 14.654 | 17.717 | – 346 | |
| Fibre | 6.350 | 38.242 | 39.481 | 5.010 | 7.859 | 4.160 | – 1.240 | |
| PS | ||||||||
| EPS | 250 | 47.194 | 45.858 | 250 | 250 | 250 | 0 | |
| GPS | 2.050 | 47.142 | 47.142 | 1200 | 100 | 80 | – 850 | |
| HI-Impact | 600 | 49.697 | 49.697 | 600 | 390 | 350 | 0 | |
| SBR | ||||||||
| Dark | 4.213 | 54.440 | 57.982 | 3.383 | 0 | 0 | + 830 | |
| Light | 3.383 | 57.982 | 57.982 | 4.213 | 40 | 40 | – 830 |
As the tables show during last week the supplies were decreased by more than 6.500 tons, whereas demands recorder for about 42.000 tons and the total trade on materials reduced by more than 12.000 tons. This has happened in a market that usually invests on polymer materials stocking and creation of black markets.
Considering last 3 weeks material trades, there has been a total of more than 21.000 tons of decrease in materials’ deals. This shows a great reduction in the attitude of traders to invest on polymers which in long term will be on behalf of the converting industries.
As a total only 48% of the offered materials was purchased and only 17 grades out of 82 offered grades were experienced competition in prices.
The highest decrease in supplies belonged to the PE film grades and PVC due to a large amount of supply by Bandar Imam PC complex. The textile grade of PP stood at the 3rd place in supply reduction.
Other analysis could be noticed by users through the above tables.


