Finally, Iran’s foreign trade statistics were announced for the last Iranian year (March 21st, 2017- March 20th, 2018).
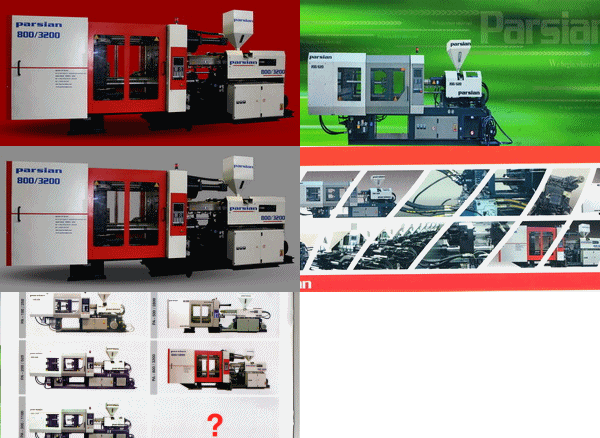
According to these statistics, the Iranian plastics industry converters have imported near 100 millions of US$ extruders and injection moulding machines during last year. More than $ 63 millions of these machinery importations has been spent for purchasing injection machines and its side equipment whereas about $ 31.5 of the budget has gone for extruders and its equipment in the year 1396.
A simple calculation based on at average rate of 40.000 Rials per one US$ during last year for importation oo such goods, shows that about 253 billion Rls. worth of plastics injection machines have been imported into Iran, out of which more than half of this amount has been spent alone for importation of the plastics injection moulding machines from China (Table I). After China, which has almost the biggest part of the stake in Iran’s market, Austria, Luxembourg and Germany are the 2nd to 4th countries respectively.
At the same time, and according to the same statistics, the amount of exports of the plastics IMM has only been $ 1.673 millions (Table II) showing a negative trade balance of $ 61.5.
An interesting point in the year 1396 was the export of the plastics IMM to Italy in 3 different months and the last one shipped in March 2018.
The two following tables below show the exports and imports of IMM machines to and from different countries.
Table I: Export of Injection Moulding machines to Iran by value
| Country | Amount
($) |
| China | 32.906.997 |
| Austria | 5.271.631 |
| Luxemburg | 4.793.797 |
| Germany | 3.783.068 |
| S. Korea | 2.615.423 |
| Russia | 2.543.500 |
| Italy | 1.993.322 |
| Switzerland | 1.848.661 |
| Japan | 1.698.718 |
| U.A.E | 1.695.625 |
| Canada | 1.370.319 |
| Taiwan | 1.261.206 |
| Turkey | 950.464 |
| Sweden | 333.084 |
| India | 191.441 |
| Total | 63.257.256 |
Table II: Exportation of Iranian made Injection Moulding Machines to other countries
| Country | Amount
($) |
| Afghanistan | 825.279 |
| Italy | 243.446 |
| Georgia | 184.930 |
| Somalia | 124.000 |
| Iraq | 120.436 |
| Turkmenistan | 85.725 |
| Tajikistan | 59.586 |
| Armenia | 18.160 |
| Azerbaijan | 11.460 |
| Total | 1.673.022 |
Now paying attention to the extruder market we can evaluate it as a market with lower interest of converters in comparison with the IMM machines. The statistics show that during last Iranian year the converters have sent almost half of the money that they paid for the injection machines.
At this sector, also, the amount of exports was not so considerable. The following tables (III and IV) show imports and exports of extruders and side equipment to and from Iran.
Table III: Export of Extruders to Iran by value
| Country | Amount
($) |
| China | 14.352.626 |
| Italy | 5.601.054 |
| U.A.E | 3.835.216 |
| Turkey | 2.561.779 |
| Germany | 2.295.473 |
| Austria | 1.050.914 |
| S. Korea | 743.743 |
| Taiwan | 463.517 |
| Belgium | 171.513 |
| Denmark | 170.544 |
| Hong Kong | 154.766 |
| India | 138.347 |
| Total | 31.539.492 |
Table IV: Export of Iranian made Extruders to other countries by value
| Country | Amount
($) |
| Afghanistan | 356.086 |
| Italy | 86.33 |
| Iraq | 24.332 |
| Armenia | 21.000 |
| Total | 488.25 |
The source for all figures is the Iranian custom office.

